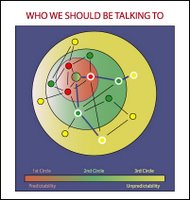
This is a graphic we use to show our 3 circles of connections in our networks.
Our 1st circle are people we know well.
In our 2nd circle are people we know but not well - they are our 1st circle people's 1st circle
In our 3rd circle are people we don't know at all, but who are known by people in our 1st and 2nd circles.
The further out we go, the more we discover people with more differences than ourselves, which in our world, means a goldmine of new possibilities!

7 comments:
Nice graphic, Jack! What did you use to make that?
It's a Mac tool called Intaglio
The graphic is very nice, but I do not like mixing quality and distance of contacts. These are two different concepts and have to be put apart.
I would prefer a graphic where the inmost circle has a color gradient indicating the quality of the direct contacts and the outer circles have sharp edges indicating the distance (length of shortest path) to the contact.
Steffen Mazanek
informatik-praxis.blogspot.com
Great - you have just articulated Granovetter's strength of weak ties theory in good short order. Now make some insightful implication on outcomes and strategies based on this theory and you have a real power move.
Good luck with this interesting blog. As far as mapping software in concerned, I've seen awesome demos with applications such as http://www.social-computing.com/,http://www.human-links.com/ and mapstan/amoweba. Friends of yours?
This is an awesome resource!
Post a Comment